Graphics

Fireworks

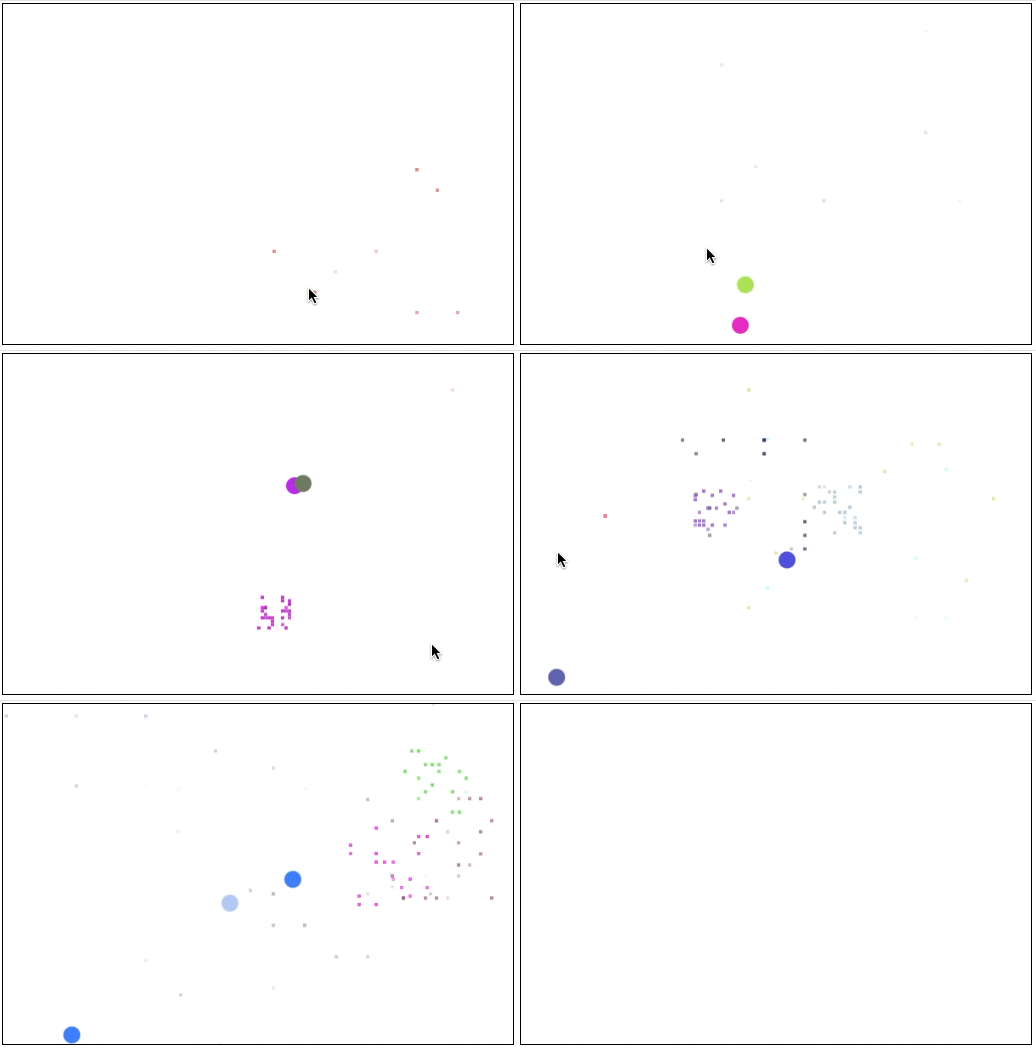
The first somewhat non-trivial thing I made in graphics. You can click and a "firework" will make its way to your mouse click and "explode". Little circles that move up the screen at random positions, speeds, and to random heights before "exploding" into little pieces. This little program captures the idea that Canvas is an immediate mode API, and you need to keep track of objects yourself, in your own data structures. In this case the objects are little circles with positions, speeds, etc. and also the pieces after they explode which also need to track their lifespan so they can fade, and eventually disappear. This also highlighted the importance of removing objects from said data structure after leaving screen, and clearing and redrawing each time in an animation loop to create movement.


Open
View Code 👇

SVG Coffee Cups

This is a very basic SVG image I made, inspired by my love of coffee! It utilizes hierarchy, definitions, re-use, etc.

View Code 👇

Quadcopter

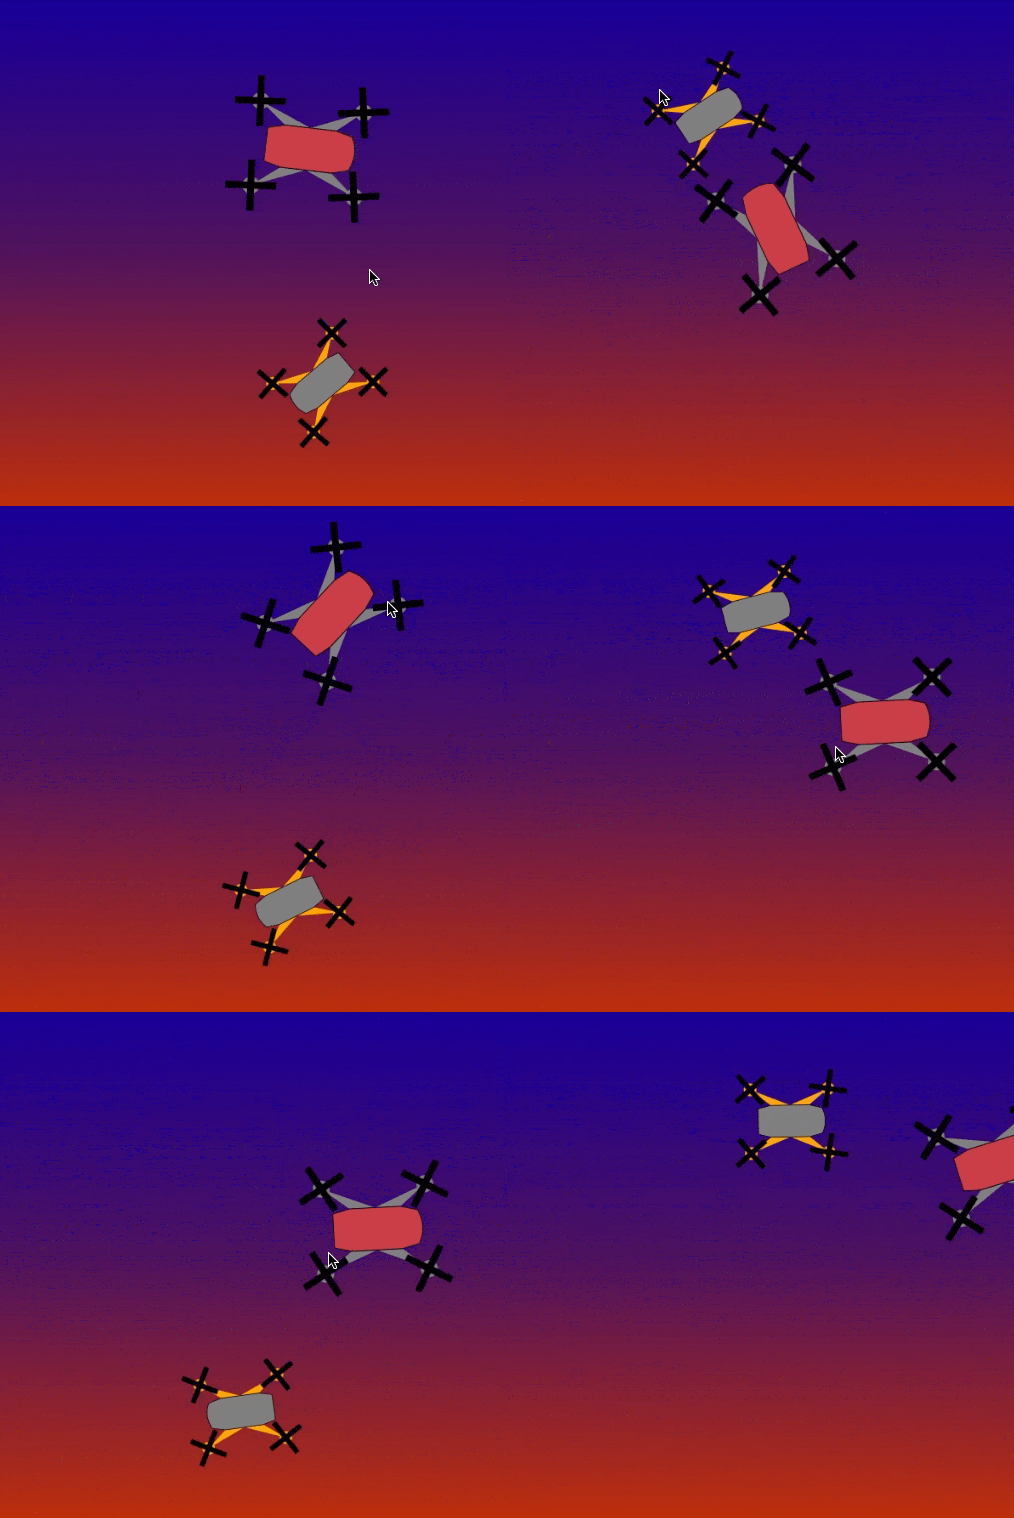
This is a scene that highlights hierarchal motion, animation, and object orienting and positioning. The quadcopters are modeled roughly after the DJI Spark drone.


Open
View Code 👇

Flocking

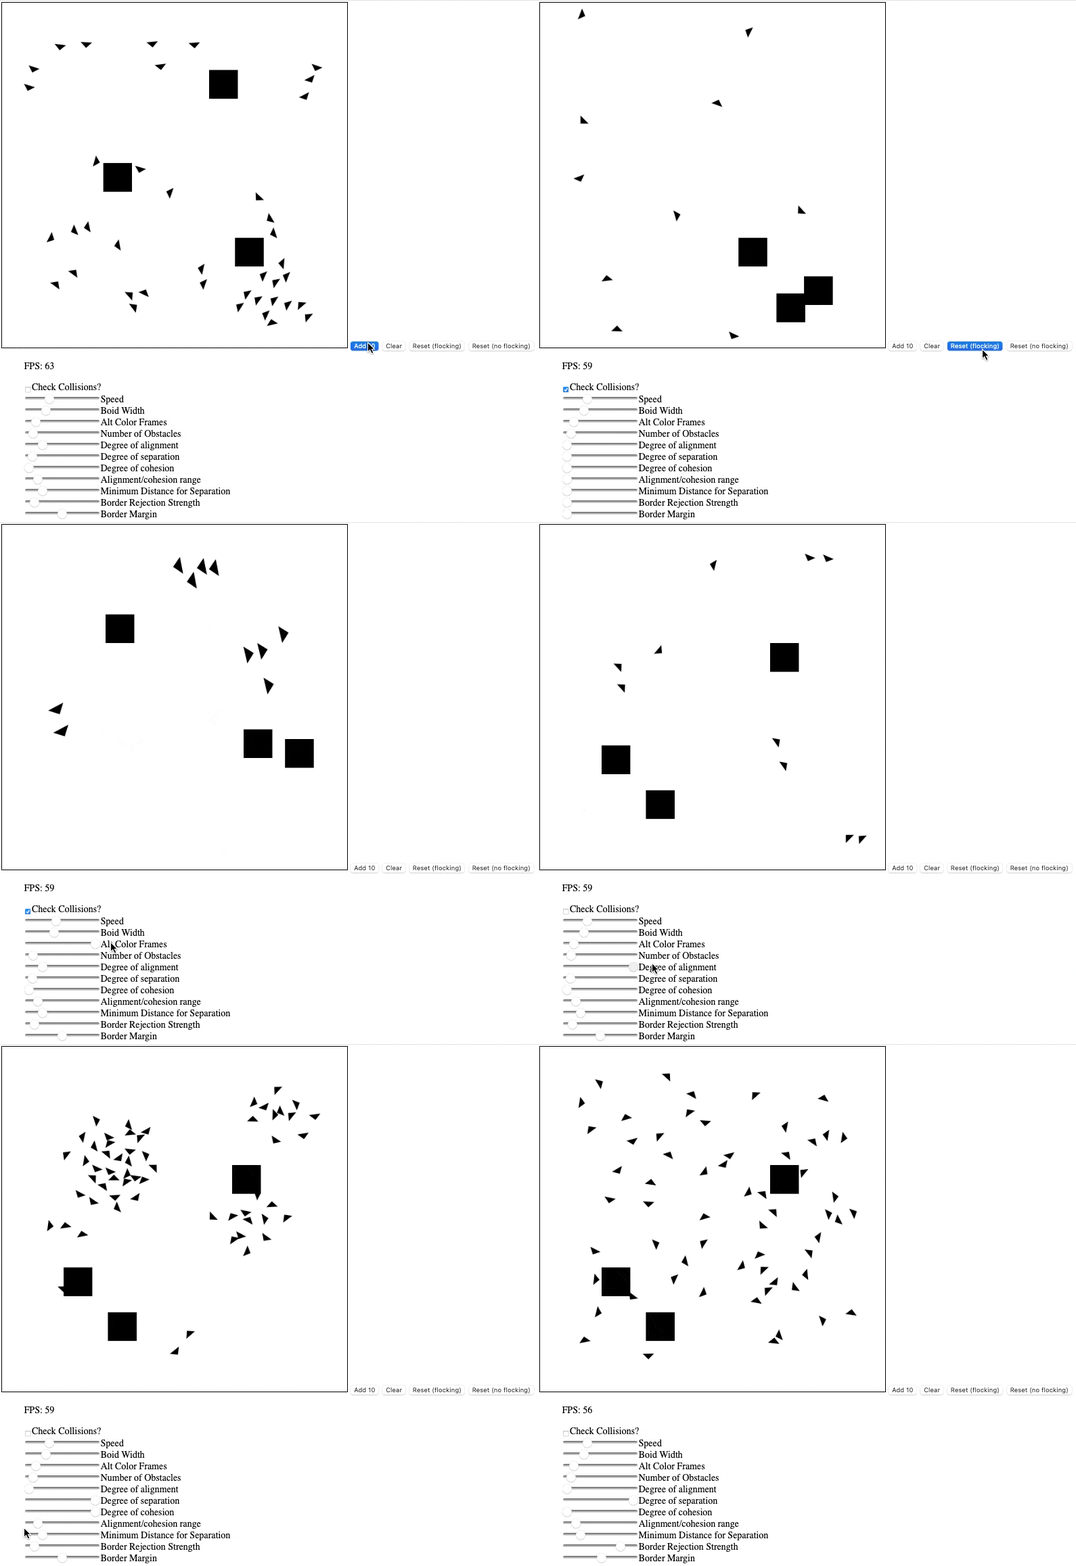
This is a little program featuring many flying objects that independently make decisions on which direction to turn which together creates a "flocking effect". This is a concept Craig Reynolds documented, and explains on his site about simulated flocking creatures called boids. You can control three parameters that dictate how the flock will behave, alignment, separation, and cohesion. There is also controls for the range of these settings, how strongly or at what point they will turn away from the edges, and more.

One of the trickier pieces to this is collision detection, which requires that the position of each boid be checked against all other boids to see if any are touching. This is then indicated by them turning red for a short (controllable) amount of time.

Another aspect of this program is the obstacles. There are by default three obstacles (squares) that are present on screen, and again all boids positions must be checked to see if they are touching an obstacle, and if so reverse direction. When more boids are added, they are placed at a randomly generated location. When the position is determined, if the boid would be inside an obstacle, a new position is generated until not inside an obstacle.

This was a super interesting project, and I found it fascinating how much simple controls and parameters (check the code for exact specifics on what they are doing) can create such a natural looking and mesmerizing "flocking" effect. Basically, the methods you’re going to experiment with have a bunch of simple objects that each make individual “steering” decisions, and maintain their speeds. This is sometimes referred to as “flocking.” The first person to really write about it in the graphics literature was Craig Reynolds who not only wrote the original flocking paper, but also maintains a good page with information about it.


Open
View Code 👇

Guitar

This is a canvas drawing I made of a guitar to learn the concepts behind bezier curves, and show my love for music and great guitar solos!

View Code 👇

Train

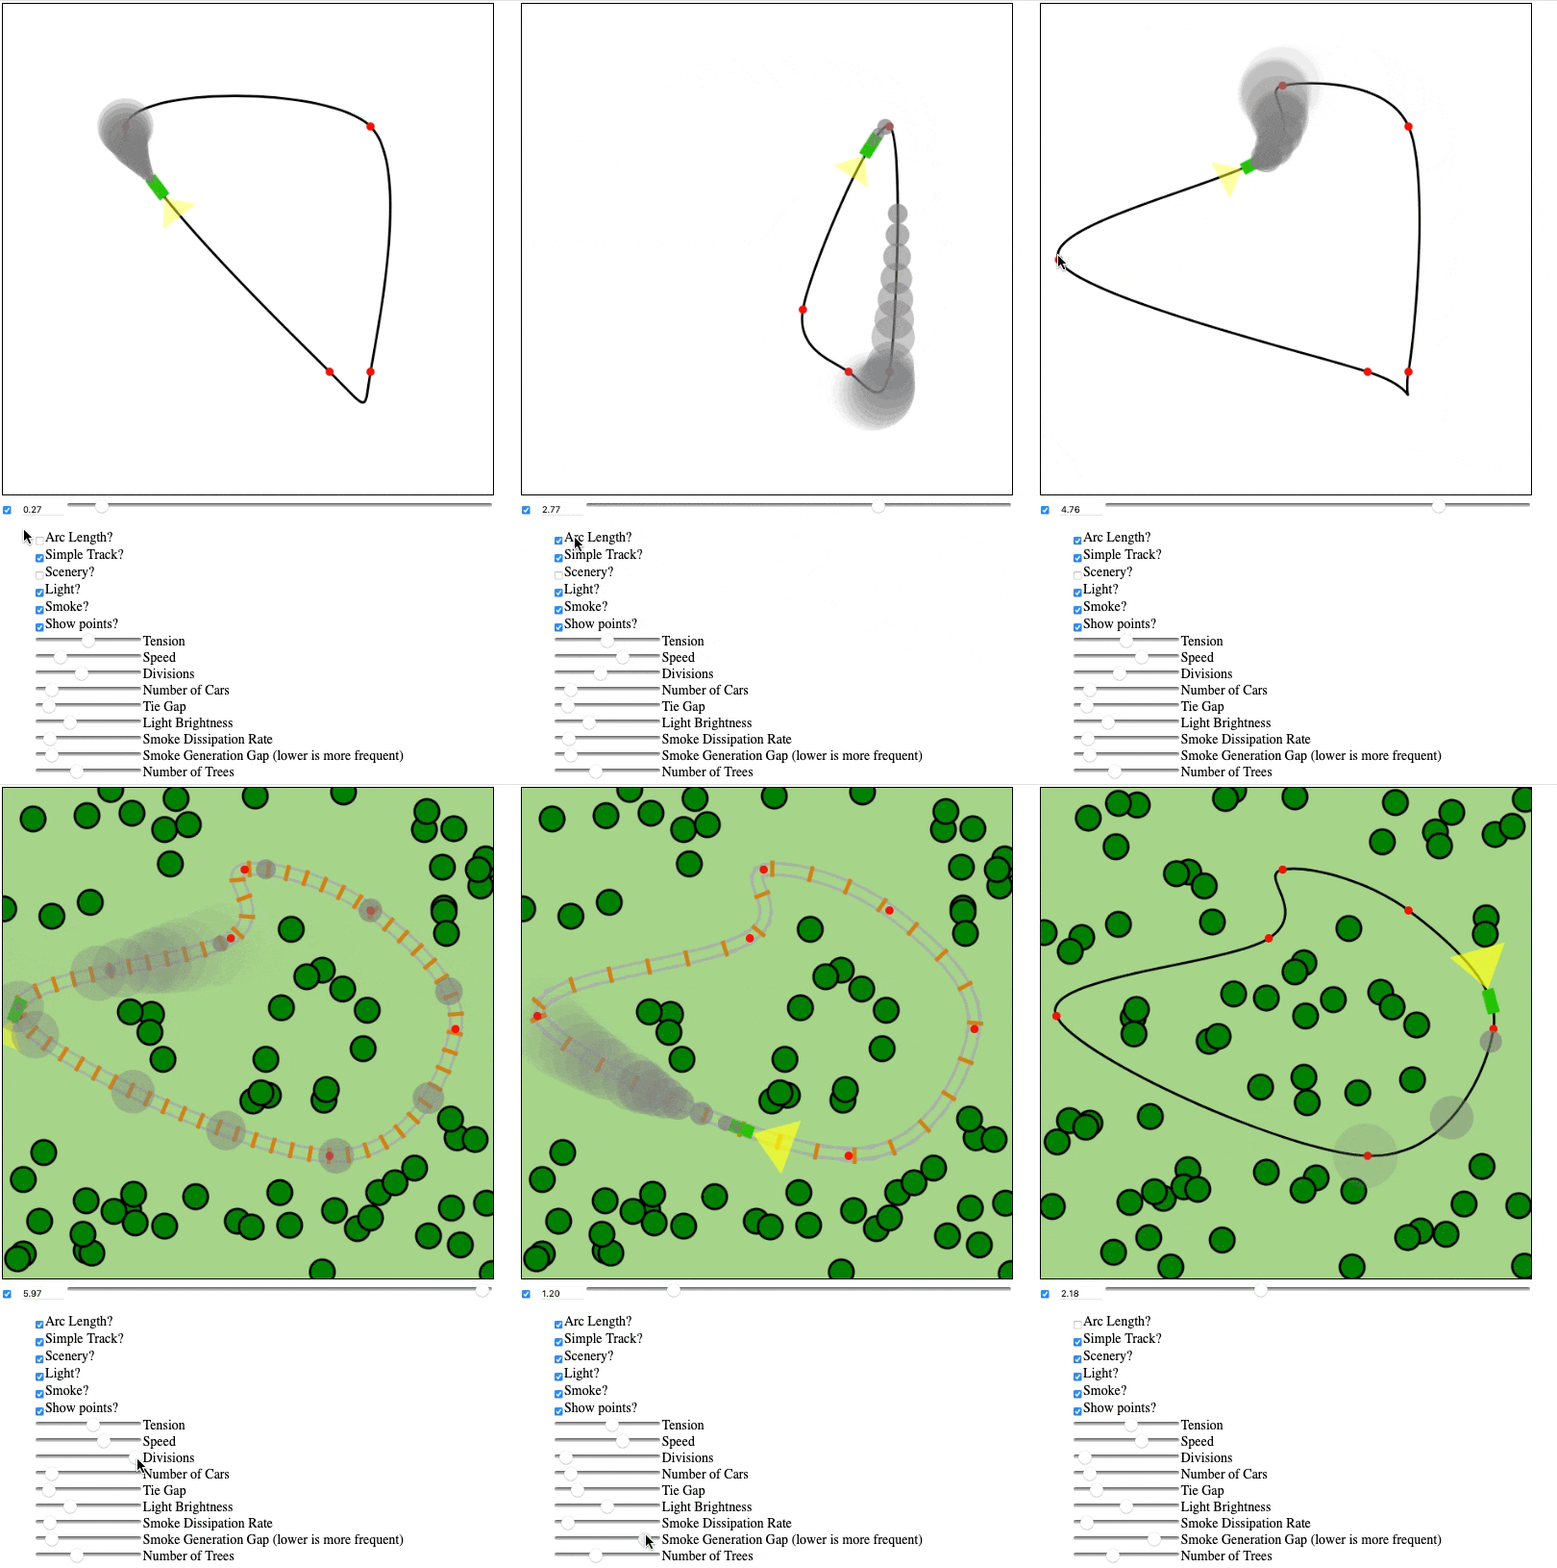
This is the last program in 2D, and one of my favorites. This project implements a simple train going around a track, though the graphics and programming concepts behind it are much more complicated and involved.

First off the train progresses around an approximated Bezier curve. This curve is interpolated from an array of points, which can be dragged around, or added to live by shift clicking. A loop goes through and uses algebra to compute the point for a given number of linear divisions. This number is controllable, and defaults to 100 (meaning between each point there are 100 small linear line segments). There is then more algebra to compute the location of the train along these segments for any given time parameter u out of 1.

To add more complexity, there is an optional arc length setting that can be enabled. Without arc length, the train will move between all points in the same amount of time, regardless of their distance apart. Meaning if there was two points 10 units apart, and two points 3 units apart, the train would move between each set of points in the same amount of time. For a more realistic effect, arc length calculated the distance of the path between the points, and normalizes the trains speed to move an equal portion for each time increment. For example, the total length of the curve is calculated (estimated based on the length of all the individual linear segments summed), and then each portion the train moves gets normalized to its proportion of the entire curve. This was one of the trickiest parts to complete, and a surprisingly difficult for how simple it seems.

Furthermore, there are other effects like multiple cars, dissipating smoke, and a more complex track. The More complex track is another deceivingly difficult element. Technically, perfectly offset Bezier curves are impossible to calculate. So instead, the curved track had to be split into many linear segments at an offset of the original to approximate what two slightly offset curves would look like. Given the desired number of divisions (and accordingly precision) each segment is split and then transformed to be x units orthogonal to the original (requiring some trig and atan2 to get the angle relative to the curve).

Finally, like with the boids there are trees that can be generated as scenery which will appear at randomly generated locations that are cross-checked to make sure they are not touching the track when created.


Open
View Code 👇

Snowman

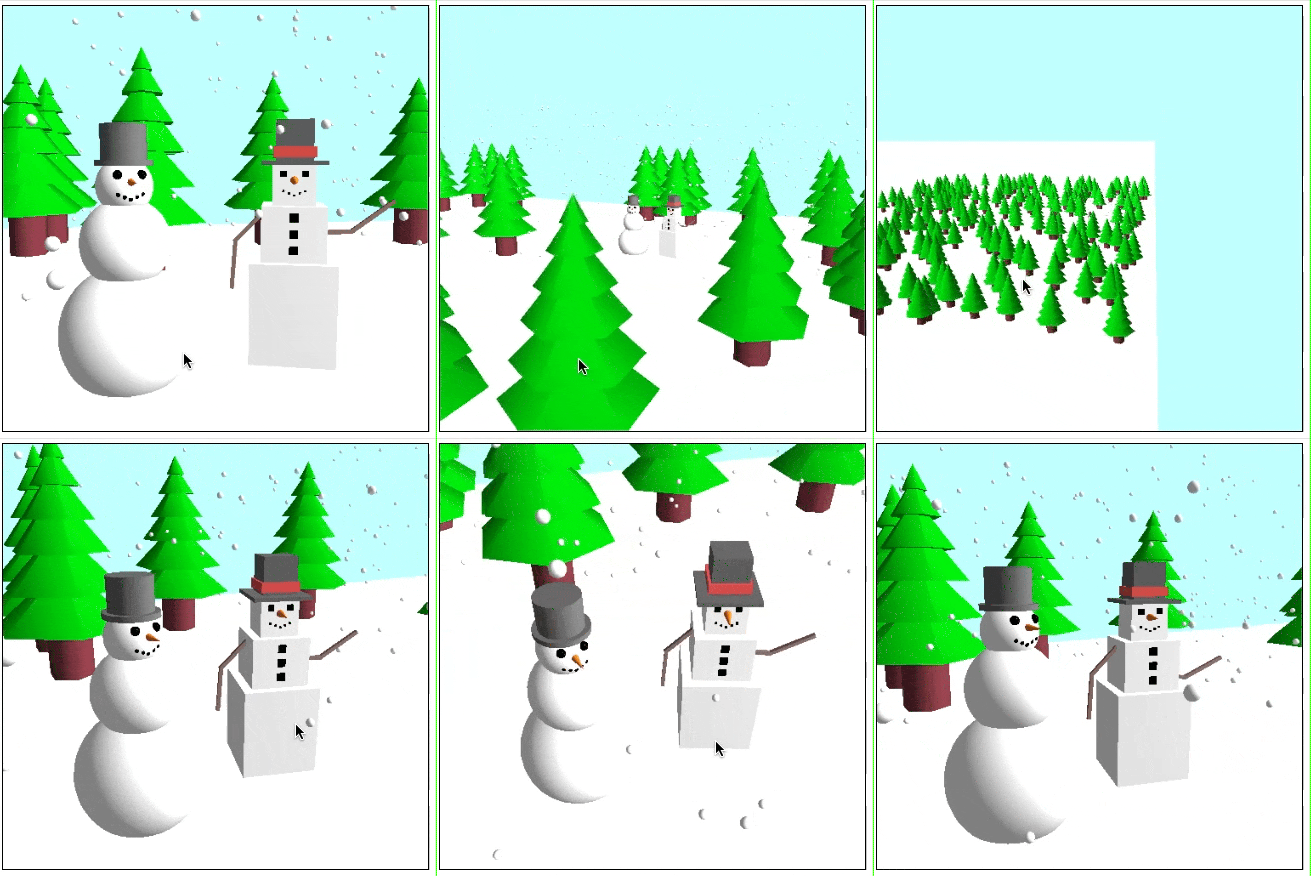
This is my first project using the 3D graphics framework THREE.js. I learned building things up by pieces, and some of the fundamentals of 3D graphics like the need for a renderer, a camera, lights, and ground plane. The trees are randomly generated and replicated to span quite far out to give an appearance of a real forest. The snow is a simple array of graphics objects that are cloned, and assigned a random velocity. The flakes are then placed at a random location, and added to the scene. Then, each time the scene is rendered the array of snowflake objects is iterated through and their positions updated based on the velocity assigned to that flake object so they all move at different, but constant speeds. Finally, if the flake's y position moves off screen, it is removed from the array of objects to be drawn each render.


Open
View Code 👇

3D Copter

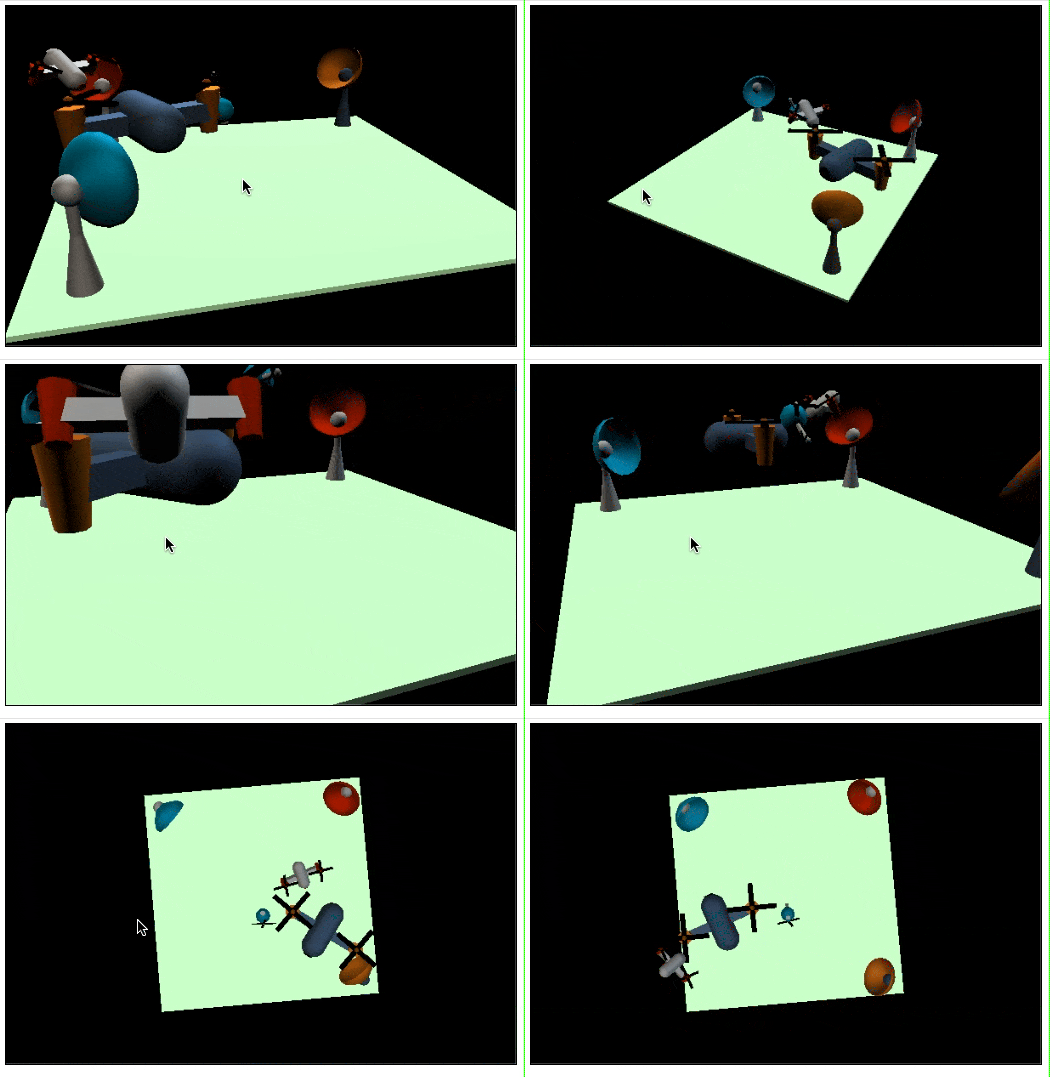
This is a cool little 3D scene involving motion related to object hierarchy (where things move attached to other moving things). One cool little feature is you can actually use your keyboard to move the copter up, down, left, right and adjust the speed, or change its color. The trickiest part to this one was animating things so they moved relative to each other, getting the dishes to point at the moving copter (requiring some trig), and simply getting things to move in a circle while pointing forward (more trig).


Open
View Code 👇

Graphics Town

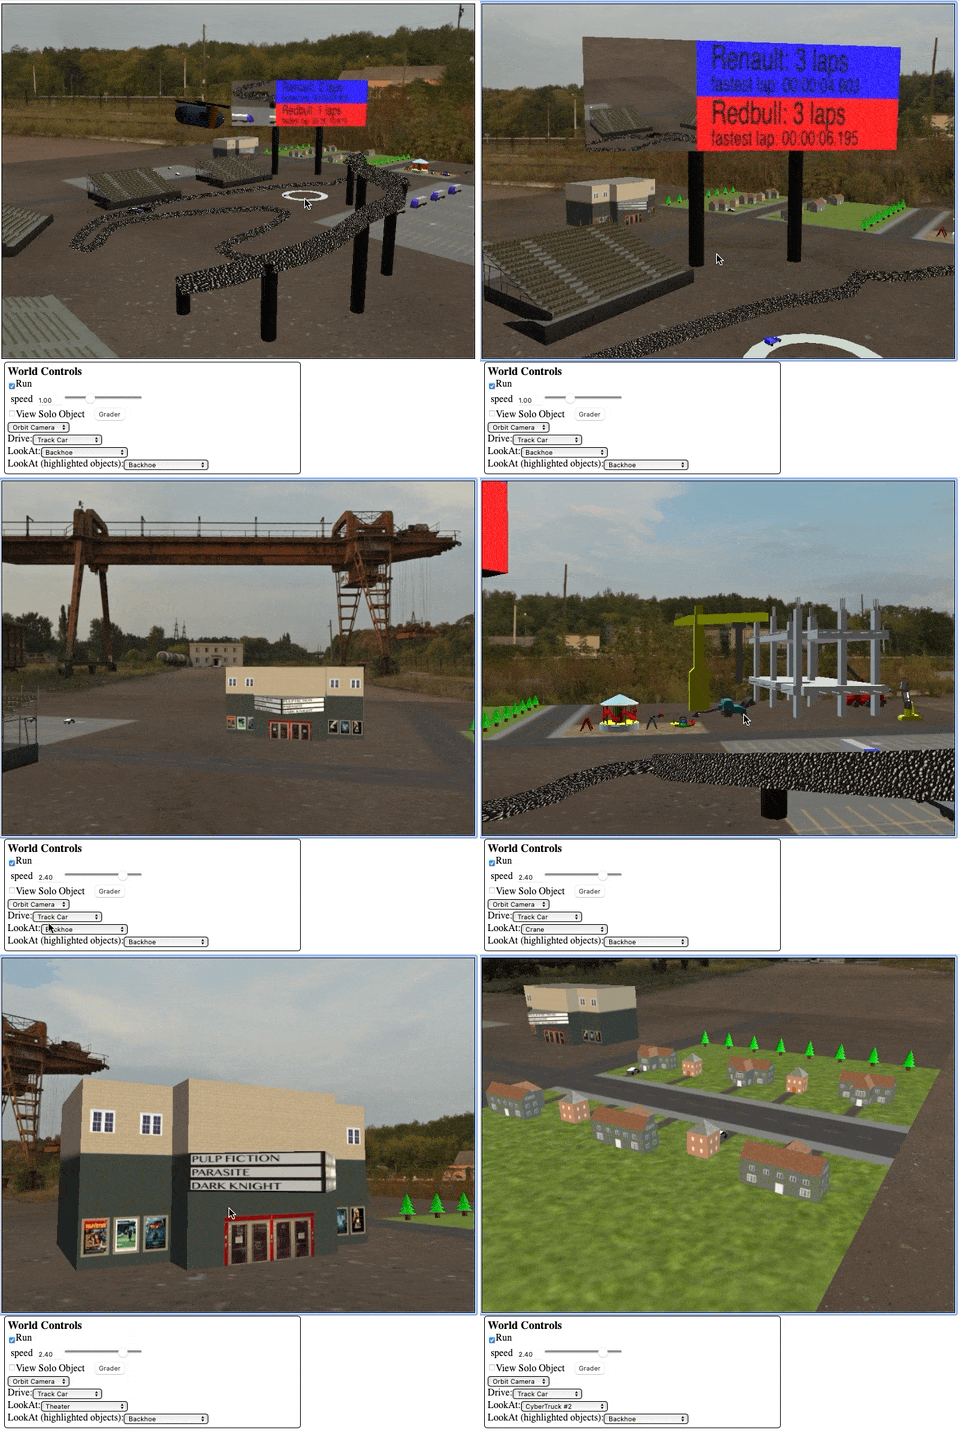
This is my final project for 559-- Graphics town. This implements many of the pieces I made earlier in the class, and some new elements as well. There are houses and a theater using custom made textures. I created the texture images in Photoshop, and then mapped the vertices of the objects (like the cube of the house) to a u,v position on the texture map. This is a process known as texture mapping, and while tedious, I found quite fun. There is also a big texture for the ground plane, and an environment map for the background that is dynamically reflected off objects, and provides its own light source to objects with low roughness.

The part I am most proud of is the track. I recently got into Formula 1 racing, and decided to make an F1 track. This is similar in concept to the train project, but this time with a 3D spline that has to account for banking, and vertical coordinates making the trig a lot more involved. The cars get a random speed to move around the track generated every set interval with a smoothing period in between to make things seem more like a race, and not two cars moving around at constant speeds. The leaderboard is a live-updating texture that is generated every render frame and tracks the fastest lap, and laps completed by each car with the leader on top. Finally, there is a second environment map that takes the form of a screen on the leaderboard. This is to simulate a jumbotron or something like that. There is also a custom WebGL shader written in GLSL applied (using vertex and fragment shaders) to create a static effect, like you may see on a screen.

Again, this is a deceptively tricky aspect to implement. In order to generate the image, a second camera has to be inserted into the scene. However, the screen cannot already be there since its contents have not been determined yet. So, multi-pass rendering is utilized to render the scene once without the screen, snap a "photo" to capture the state, and then render a second pass that then includes this capture as an image on the board. Keep in mind, this is done every frame, or 60fps, or every 16.7ms.

You can read more about the specifics and everything I implemented in these text files for the submission:

Open View Code